")
New Relic Integration Into Cartika Services
Cartika is pleased to introduce New Relic analytics integration and roll out (phased roll out outlined below). We are very excited about this roll out and what it will mean for both our customers, and internally for our support staff to have access to this data. The benefits it will present to our customers is simply enormous. Developers, Sys Admins and DBA’s will gain invaluable insights into the health of their environments, be able to more quickly identify problems, streamline their resource usage and make educated decisions about capacity and capacity planning. Internally, we are very excited to provide these sorts of tools and analytics to our support staff. Their ability to help customers identify issues, identify bad plugins or bad code and provide advise and consultations regarding upgrading strategies, code optimization and various other day to day issues is simply increased exponentially and dramatically. Their ability to identify such issues is expedited by presenting them the data in real time, in an easy to understand and clearly defined interface. We are enabling our support staff, with the tools they need, to quickly and efficiently provide the superior level of service and support we demand from our team. New Relic is “a Software Analytics company that makes sense of billions of metrics across millions of apps. We help the people who build modern software understand the stories their data is trying to tell them.” Cartika is very excited to be bringing these metrics to all of our customers, as well as a suite of internally developed graphs and processes to bring additional value to all of our customers. Below, I will outline our roll out plans, and the impact each phase will bring to our customers and services. Phase 1 – Shared/Reseller Servers We have configured New Relic on all of our Shared/Reseller Servers. This is available as of today and will further improve the uptime and availability of our shared/reseller environment. I am personally very proud of our shared/reseller uptime levels, as we have consistently met and exceeded our 99.9% uptime SLA for 15 years now. We are always working on improving our solutions and offerings and service levels, and feel the additional value to our customers here will be very high. With this technology, we can be even more proactive in identifying issues before they become service impacting. And when there is an issue, our staff can identify and resolve the exact source of the problem, much more quickly and efficiently. If a customer is being attacked, or a customer has uploaded a bad WordPress plugin that is eating up CPU, RAM and/or IOPs, our staff will immediately know which account is spiking, exactly how much CPU, RAM and IOPs they are using, which script is causing the issue and what their database queries look like. All in a single view and all within a few seconds. Our ability to identify and respond to any such scenario within seconds will only result in a much more proactive approach then we already employ and will further remove any potentially service impacting issues. It will allow us to respond to any such potential issues much more quickly and efficiently. This can do nothing but improve on our already amazing uptime and performance metrics Cartika customers have enjoyed for 15 years now.
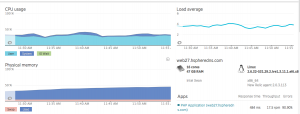
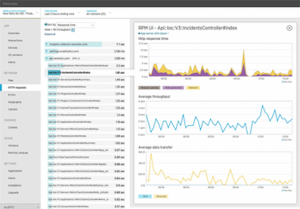
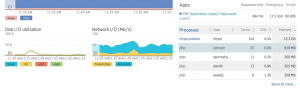
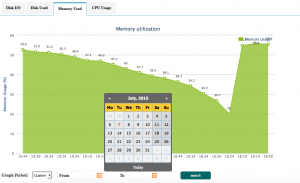
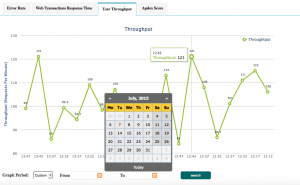
Phase 2 – Managed Server/Cloud Server/VPS Server Customers Using New Relic data, Cartika will be displaying data on basic server and application usage to all managed server/cloud/vps customers from within their accounts.cartika.com portal. This data and integration is provided for FREE for all existing and future Cartika Managed Services customers. We have built an application to collect and store New Relic data. We will maintain historical data from the date of activation of the New Relic Service on respective servers/vm’s/vps’s and present it to our customers. This data will provide our customers with both server insights (CPU, RAM, DISK, IO) as well as application insights (response time, error rate, visitor throughput, etc). Additionally, we are including a customizable and personalized notification system so that managed customers will be notified instantly, or via a scheduled digest of key events. For example, if CPU is over 80% and how often. If RAM usage is over 80% and how often, if one of your disks or partitions is exceeding 80%. Customers can utilize this data and these notifications to address their capacity planning and decide when they need to optimize their usage and coding and/or when they need to scale their resources and plan their capacity. The graphs and data within your accounts.cartika.com portal will look like the below. We are currently wrapping up the integration of this data with our accounts.cartika.com portal and are planning/scheduling the roll out to all of our managed customers.
Phase 3 – IaaS Server and IaaS Cloud Customers Customers in pure IaaS (ie self managed/reactive managed) environments will be enabled with the ability to integrate New Relic with each and every VM created within their IaaS accounts or with every IaaS Physical Server. They will be presented with the same data our Managed Services customers enjoy. They will also receive a free server monitoring and notification utility they can configure to notify them of any critical server or application metric. Simply an amazing and invaluable value add for all of our Infrastructure as a Service customers. We will roll this out and make this available to all IaaS customers (and again, for FREE 🙂 ), as soon as we finish pushing this out to our Managed Services customers base.
Phase 4 – Offer our Managed and IaaS Customers an upgrade option to New Relic Enterprise Edition New Relic Enterprise Edition offers all sorts of advanced metrics, advanced log retention, advanced log analysis and queries, granular database query intelligence, browser and mobile app analysis and much much more. Customers will be able to seamlessly upgrade to New Relic Enterprise Edition from within their accounts.cartika.com portal and receive all of the data and intelligence it offers. Cartika utilizes New Relic Enterprise Edition for our own internal servers, applications and our shared/reseller environments. We are very excited to offer these advanced capabilities to any of our customers who require even more detail and reporting abilities from New Relic then we are already including for free as outlined in the above phases. We have worked diligently with New Relic to provide a competitive upgrade price to New Relic Enterprise version for all Cartika customers who require this level of metrics and reporting. Meanwhile, we want to thank New Relic for making such a large portion of their services available to Cartika and our customers in a manner which allows us to present this as a free value add to our customers. Allowing us to integrate this level of data and analytics to this extent into our accounts.cartika.com portal is simply amazing and certainly they have gone above and beyond their normal free level for us. Once everyone has access to, is using, and is loving the New Relic data we are presenting them, we will work on developing an upgrade process, packages and integration to allow any of our interested customers to quickly, easily and cost effectively upgrade to New Relic Enterprise from their Cartika account portal.
Subscribe to Cartika
Receive a coupon code for 99% off your first month of services immediately after completing the form below!
